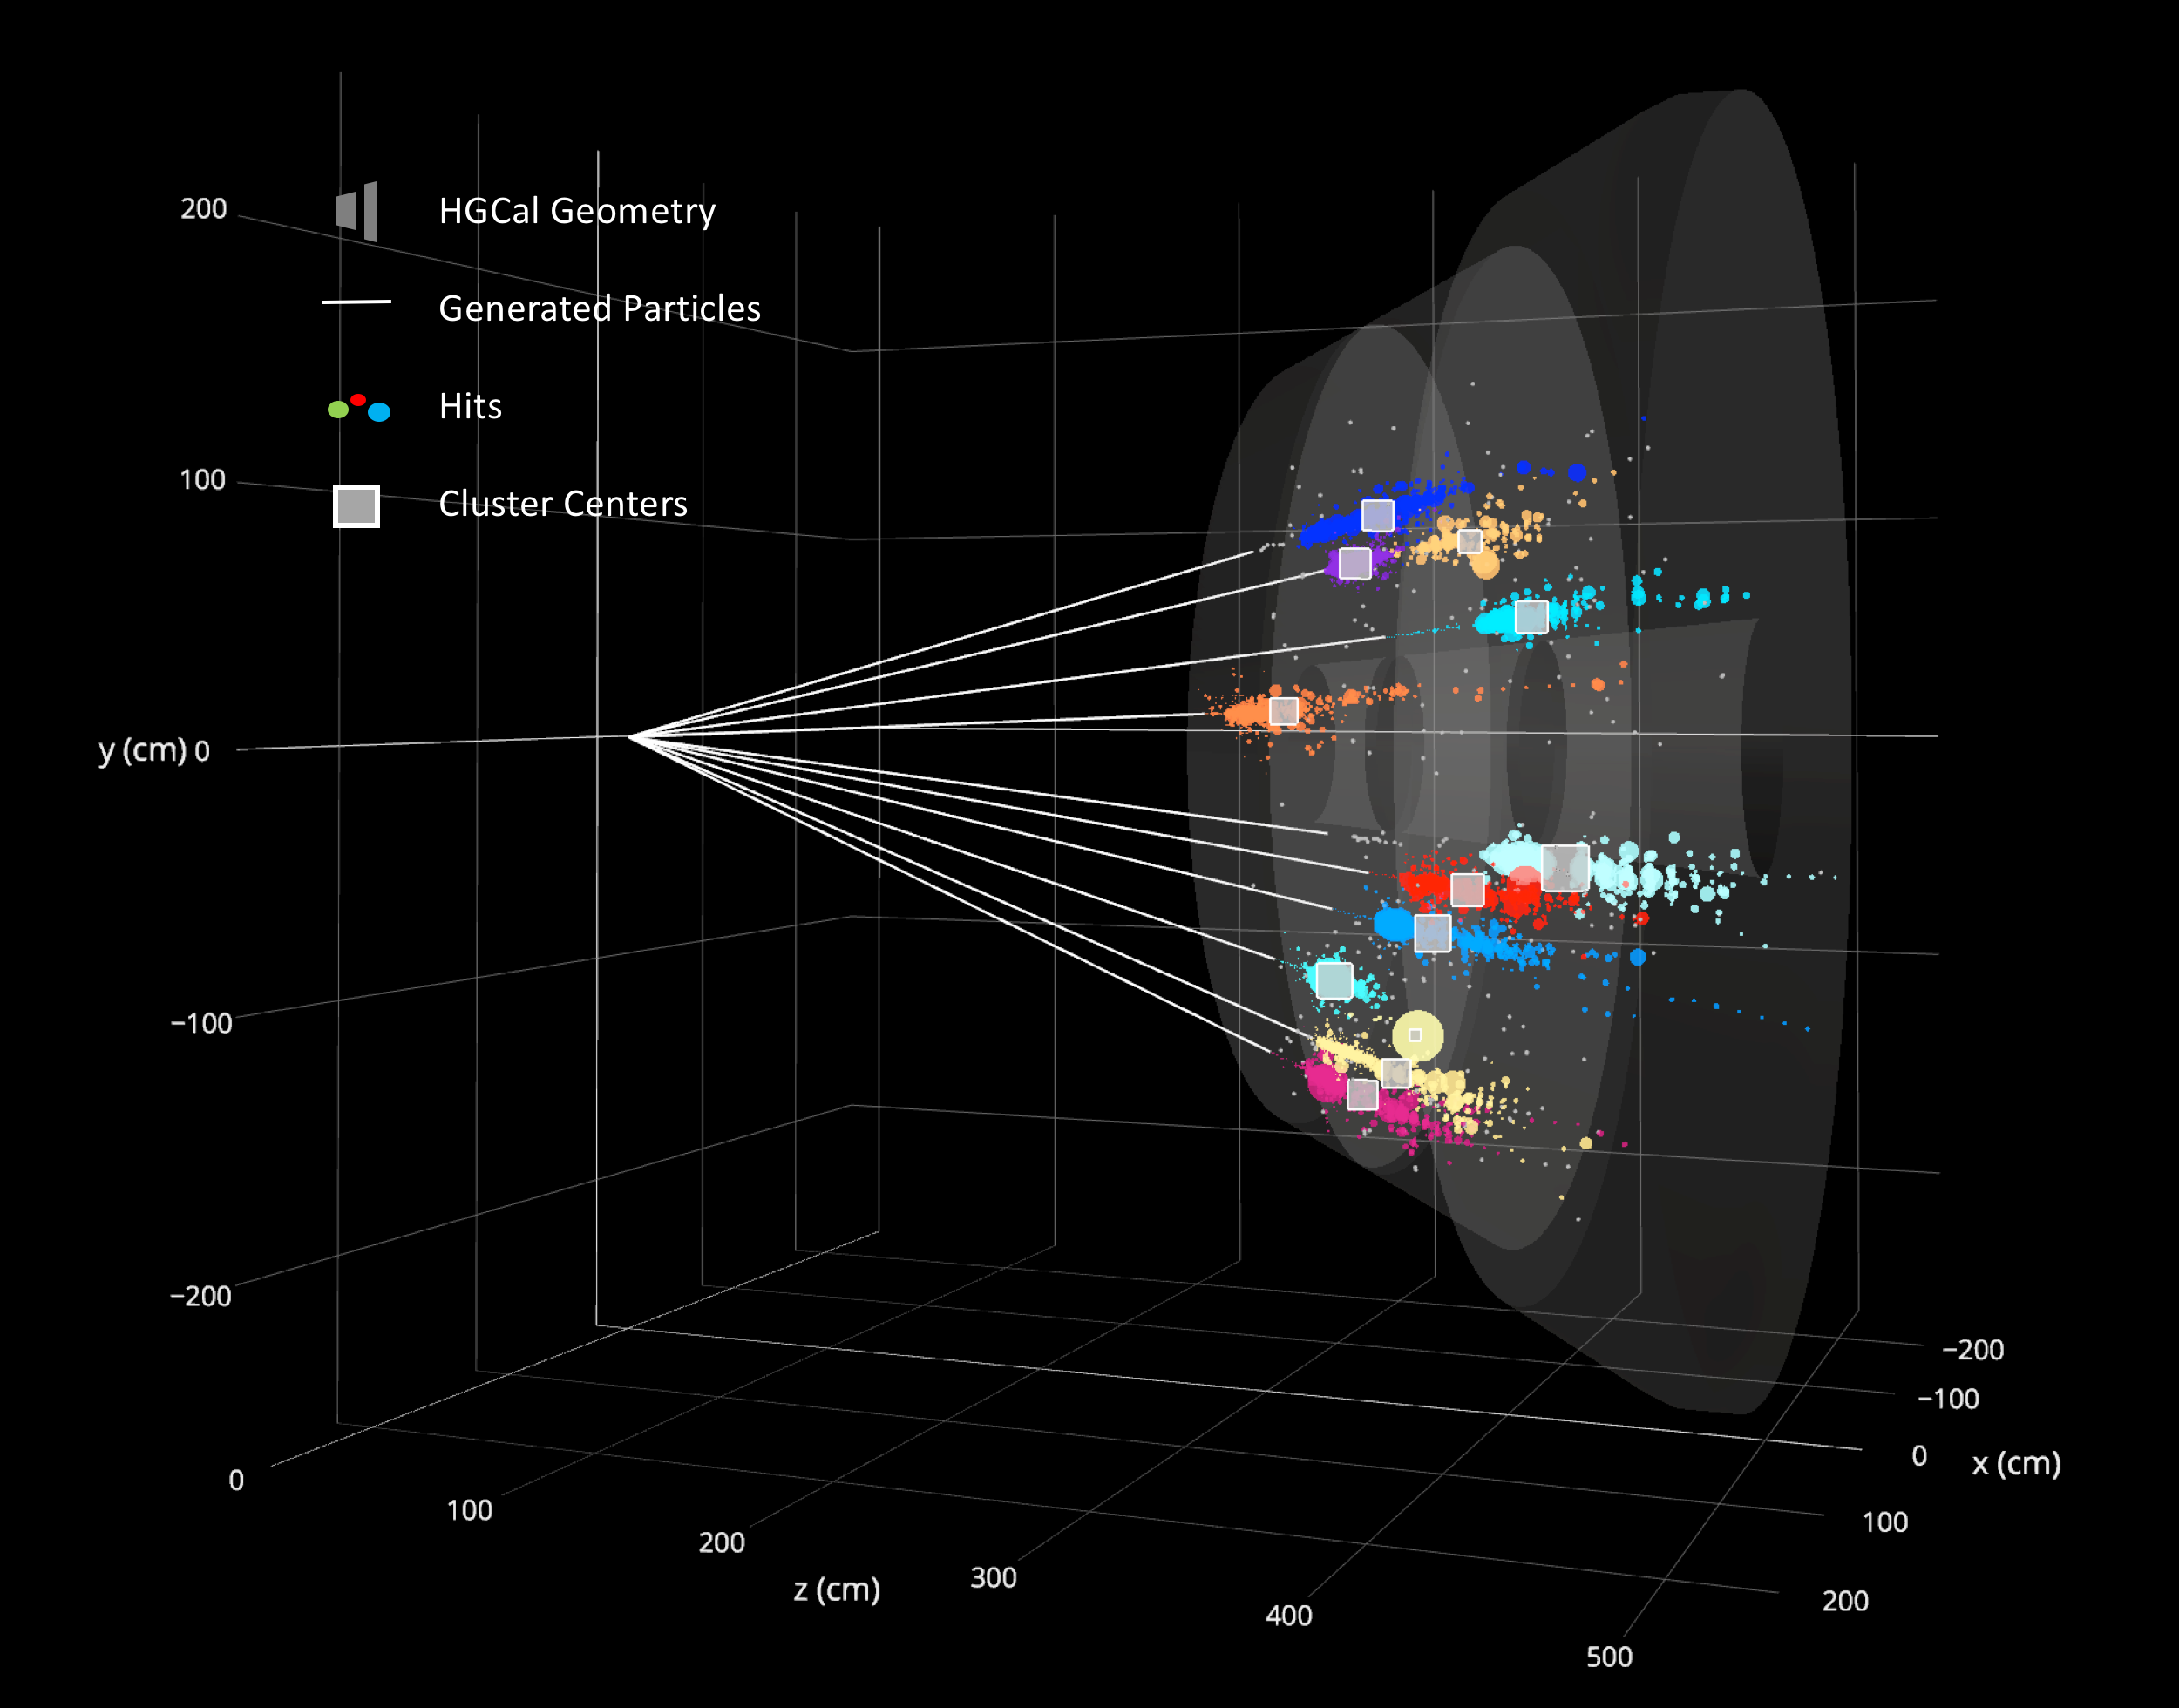
This is a visualization of an event reconstructed in CMS HGCal. This event is consist of 10 pions with a transverse momentum of 35 GeV. The reconstruction algorithm groups all valid energy deposits (hits) into clusters, each incoming particle having one or a few corresponding clusters, so that the energy of incoming particles can be calculated. This plot illustrates that our GPU-accelerated reconstruction produces a visually correct result of hit clusters: 10 generated pions, shown as ten white straight lines, are shot from the origin into HGCal, causing thousands of hits. For each incoming pion, the reconstruction successfully produces one or a few clusters of hits, indicated by the colors. The cluster centers are shown as white squares, sizes of which correspond to cluster energies.
Description
Large Hadron Collider (LHC) at CERN will start a new era of high luminosity of 13TeV proton-proton collision in 2020. To adapt to this upgrade, CMS collaboration is developing a new generation of the end-cap calorimeter, the High Granularity Calorimeter (HGCal), with better energy and spacetime resolution. Here in this project, we did a GPU implementation of the offline reconstruction algorithm and a visualization of its reconstruction result.
The plot above is an event display of 10 pions with the transverse momentum of 35 GeV. The reconstruction algorithm needs to group all valid energy deposits, so-called hits, into clusters, each incoming particle having one or a few corresponding clusters so that the energy of incoming particles can be calculated. Three critical steps are involved in this project:
1) Detector simulation
Monte-Carlo simulation of HGCal is carried out on the batch system at CERN. The details of geometry and material of HGCal detector are modeled carefully in GEANT4 by the CMS collaboration. Here we generate high energy particles of our interest (e.g., photons, pions) and shoot them into HGCal. In Monte-Carlo simulation, these high energy particles produce the thousands of digitized energy deposits (hits), which are then inputted into offline energy reconstruction.
2) Energy reconstruction on GPU
To reconstruct the particle energy, we perform clustering on HGCal hits. The clustering algorithm is inspired by the Science paper, Clustering by fast search and find of density peaks and is optimized specifically for HGCal geometry1. We implement two GPU versions of the same HGCal reconstruction algorithm — one based on CUDA, the other based on OpenCL. Preliminary optimization shows that for PU200 events, NVIDIA GTX1080Ti GPU has more than 30x speedup over Intel-i7 CPU.
3) Visualization
The visualization of reconstruction result is made via python API of plotly. It outputs an interactive webpage of a 3D plot2. Just like this one. The plot illustrates the HGCal geometry, generated incoming particles, digitized energy hits, as well as the reconstructed clusters, overlaid in an intuitive and informative way. This visualization has played an import role in our R&D and presentation.